Is Inventory Getting Back To Normal?
Is Inventory Getting Back To Normal?

After years of limited housing options, the market is finally starting to shift in your favor.
Inventory is increasing across the country, which means you may have more choices when it comes to finding the right home. But keep in mind—how much inventory is available can depend on your specific area. That’s where a local expert becomes essential.
Here’s a snapshot of where things stand today.
Significant Growth Across the Nation
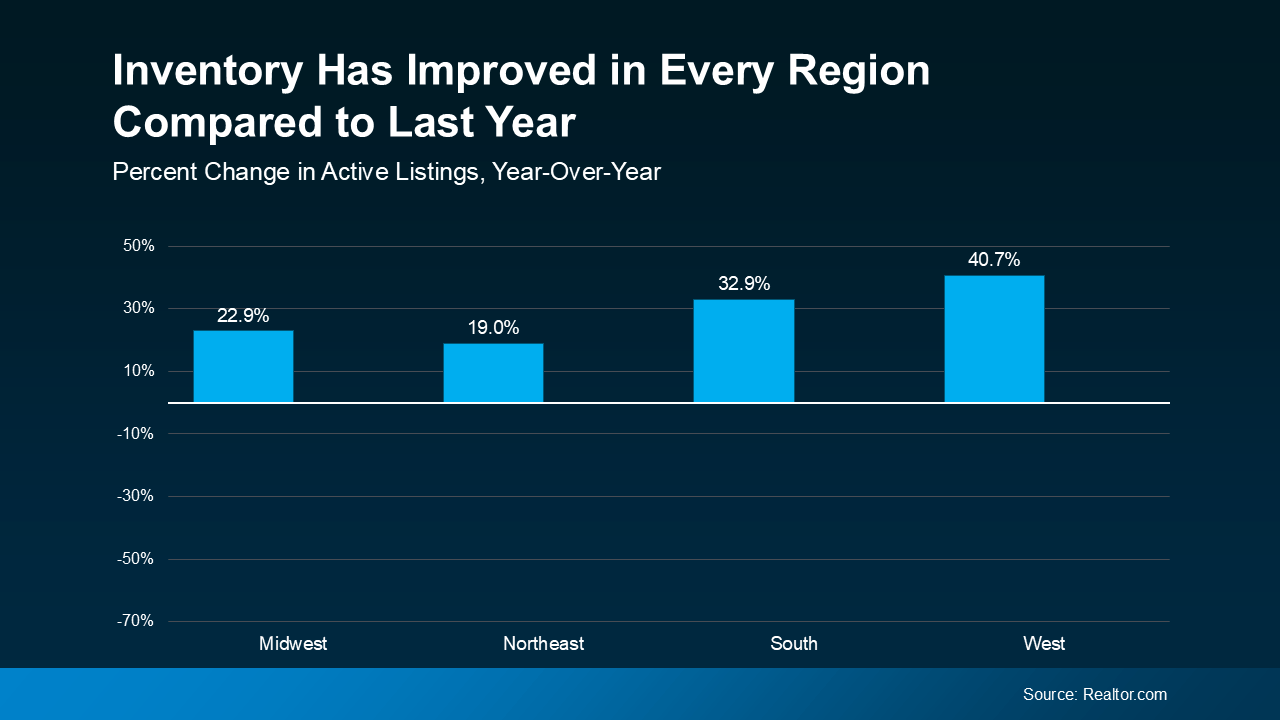
Housing supply is rising nationwide—and that’s true in every U.S. region. According to data from Realtor.com, each of the four regions has seen at least a 19% increase in available homes compared to this time last year. In the West, inventory is up nearly 41% year-over-year (see graph below):
There are two primary factors behind this rise:
A greater number of homeowners are choosing to sell. Many were holding off, hoping for lower mortgage rates. Now, some are moving forward despite that. This past May saw the highest number of new listings for any May in the last three years.
Properties are spending more time on the market. That results in listings accumulating, increasing the total supply of homes. In May, the average time on the market was 51 days – aligning more closely with typical market conditions.
An increase in available homes helps bring more stability to the market. Recently, sellers had most of the control. But now, the situation is beginning to shift. It hasn’t fully transitioned into a buyer’s market nationally, but conditions are gradually improving for those looking to purchase. Danielle Hale, Chief Economist at Realtor.com, says:
“The number of homes for sale is rising in many markets, giving shoppers more choices than they’ve had in years . . . the market is starting to rebalance.”
The Level of Growth Differs by Region
However, reaching full balance depends on the area. Some markets are approaching inventory levels seen before the pandemic, while others still lag behind.
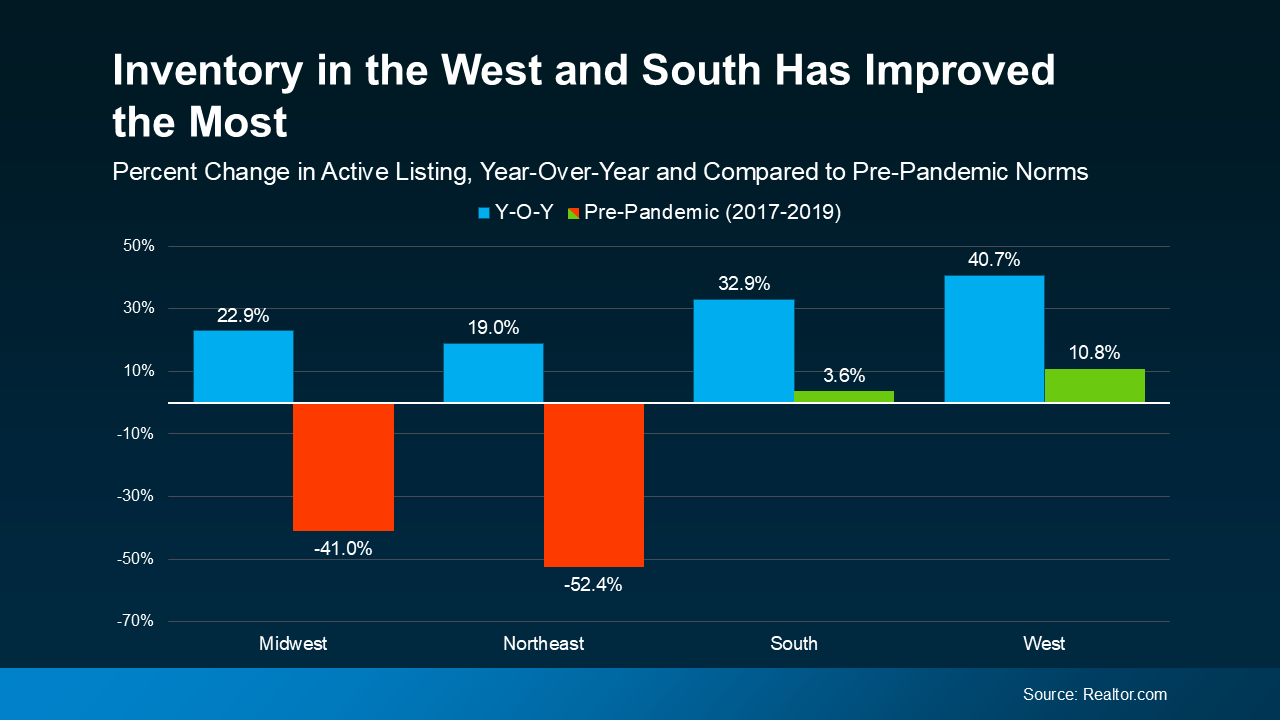
Let’s refer to another chart. This one compares the current figures (as shown earlier) with inventory levels from the most recent stable housing years (2017-2019).
In this view, green indicates the areas that are returning to more typical inventory levels based on recent growth. Red highlights those regions where inventory has risen, but is still significantly below average (see graph below):
Here’s what that means for you: overall, there are more homes to choose from now than there were a year ago. That’s a definite advantage. With more inventory, it becomes a little easier to find a home that suits your needs.
Still, conditions vary by location – some markets may take more time to return to normal inventory levels. That’s why it’s helpful to work with a local real estate professional. They can explain how inventory has changed in your area and guide your search based on what’s currently available. This is one of the many reasons local expertise is so valuable.
Bottom Line
Inventory is improving, but the pace of that improvement depends on the market. Let’s connect and discuss what’s happening locally and how it may influence your next steps.
What’s something you’ve observed recently that feels different from a year or two ago in today’s market?
Categories
Recent Posts


GET MORE INFORMATION